Description
In image processing, data mining, neural networks, etc., we need to draw graphs from input or output data.
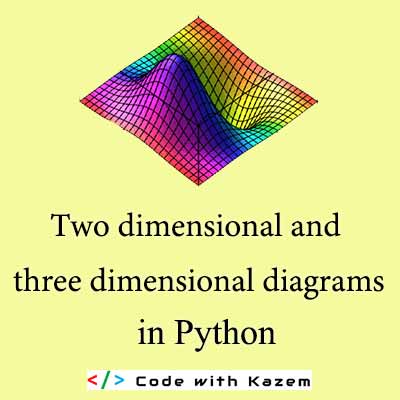
This tutorial shows how to draw two-dimensional and three-dimensional diagrams in Python.
Heading:
Commands for drawing two-dimensional diagrams
Regulatory commands for drawing diagrams
color change
Adjust the width of the chart line
Draw several diagrams on top of each other
Draw several diagrams in one window
Relationship between charting in MATLAB and Python
Adjust chart width and dpi
Adjust the x-axis display width
Label x-axis and y-axis
legend
The difference between automatic and inline
Draw a bar chart
Draw a scatter chart
Draw a three-dimensional diagram

Reviews
There are no reviews yet.